Sales Insights Dashboard in Tableau
- Built an interactive Tableau sales dashboard featuring dynamic filters, KPIs, and visual
breakdowns by region, time, and sub-category to deliver clear business insights. - Enabled data-driven decision-making by highlighting performance trends, optimizing
storytelling with clean layout, and showcasing key profit and quantity metrics.
Overview
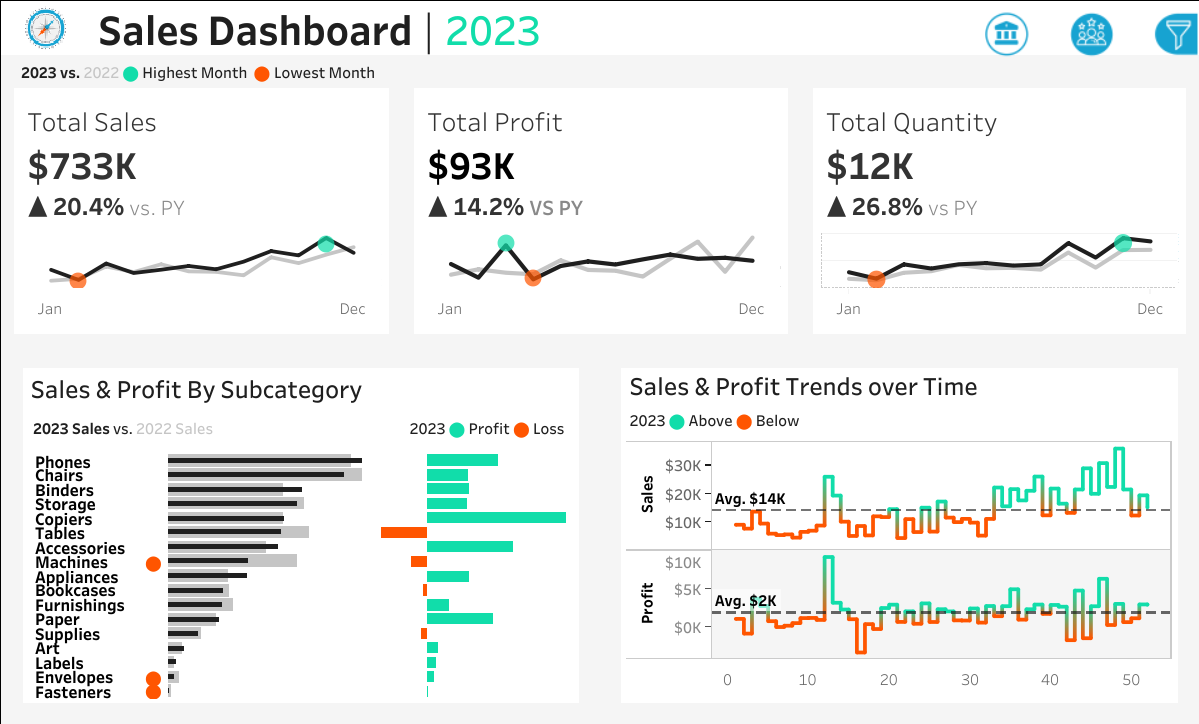
This project presents an interactive Tableau Sales Dashboard that consolidates key performance indicators (KPIs) for sales analysis. It enables users to monitor sales trends, revenue distribution, and performance by categories such as product, region, and time. The dashboard is designed for business managers and analysts to quickly understand performance drivers.
Objective
The goal of the dashboard is to:
- Track total sales performance at a glance.
- Identify best-performing product categories and subcategories.
- Compare regional sales trends for strategic decision-making.
- Provide decision support for sales planning and forecasting.
Process
Data Preparation:
- Extracted raw sales data from the source file (Excel/CSV in Tableau package).
- Cleaned and formatted fields (dates, categories, regions, revenue).
- Created calculated fields for KPIs such as total sales, average sales, and growth rates.
Dashboard Design:
- Built multiple worksheets for category-wise sales, regional performance, and monthly trends.
- Integrated charts (bar, line, pie) for intuitive comparisons.
- Applied filters for dynamic interactivity (date range, region, category).
Publishing:
- Combined worksheets into a single interactive dashboard.
- Published to Tableau Public for live access.
Insights
- Category Performance: Certain categories (likely Technology/Office Supplies) dominate overall sales, while others lag.
- Regional Trends: Sales are uneven across regions, highlighting potential growth areas.
- Time Analysis: Sales trends reveal seasonal spikes, helping in inventory and resource planning.
- Interactive Filtering: Managers can drill down by category/region to identify key growth opportunities.