📘 Project Overview
QuickBite Express, a food delivery startup, faced a major drop in orders, customer satisfaction, and delivery performance during a crisis period.
This project uses data analytics and visualization to uncover the key causes of decline and recommend data-driven recovery strategies.
The project was built as part of the Codebasics Power BI Resume Project Challenge, where participants create end-to-end analytical solutions using real-world business cases.
🎯 Objectives
The analysis focuses on six key questions:
- 🧍♂️ Customer Segments: Which customers can be recovered, and which require new strategies?
- 🛒 Order Patterns: How did order behavior change across Pre-Crisis, Crisis, and Recovery phases?
- 🚴 Delivery Performance: What were the SLA compliance gaps and delivery delays?
- 🎯 Campaign Opportunities: How can targeted campaigns rebuild trust and loyalty?
- 🍴 Restaurant Partnerships: Which partners drive long-term value retention?
- 💬 Feedback & Sentiment: How did ratings and reviews evolve during the crisis?
🧱 Data Journey
🔹 1. Data Sources
- 8 CSV files (4 fact + 4 dimension tables):
🔹 2. Staging (MySQL)
- All files loaded as
VARCHAR into staging tables (stg_*). - Performed sanity checks:
- ✅ Primary/Foreign key integrity
- ✅ Date and numeric format validation
- ✅ Logical reconciliation (
subtotal - discount + delivery_fee = total)
- Fixed inconsistent
acquisition_channel values. - Removed invalid
customer_id and order_id records. - Derived columns:
order_monthsla_diffphase (Pre-Crisis, Crisis, Recovery)- Ensured consistent date formats (YYYY-MM-DD).
🔹 4. Modeling
- Snowflake schema with fact_orders at center.
- Relationships:
fact_orders ↔ dim_customerfact_orders ↔ dim_restaurantfact_orders ↔ fact_ratingsfact_orders ↔ fact_delivery_performance- Created calculated measures:
Total RevenueAvg RatingSLA Miss %Order Drop %Customer Churn %
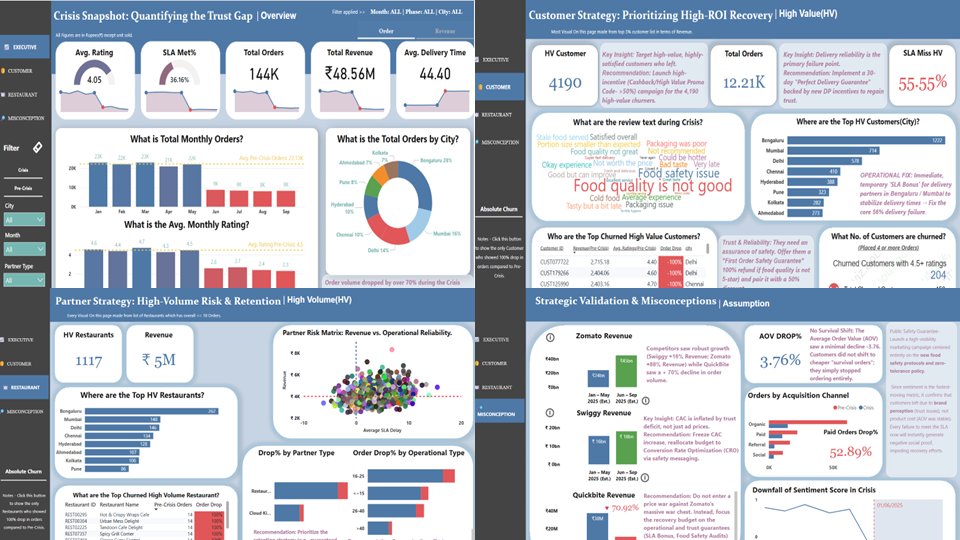
🔹 5. Visualization (Power BI)
- Built 5 interconnected pages:
- Executive Summary
- High-Value Customers
- Restaurant Partnerships
- Misconception & Assumptions
- Custom theme (
QuickBite Theme.json) using brand colors (#4E79A7, #F28E2B, #59A14F). - Added interactive slicers (Phase, Month, City).
🧠 Key Insights
- 📉 Orders dropped 70% during the crisis period.
- 🕒 SLA breaches increased by 55%, directly impacting customer ratings.
- ⭐ Top 5% high-value customers saw largest rating decline.
- 🏙️ Tier-1 cities like Bengaluru and Mumbai faced sharpest drop in order volume.
- 💬 Sentiment analysis revealed keywords: “late”, “cold”, “cancelled” – indicating delivery reliability issues.
💡 Business Recommendations
- Operational Excellence:
Reduce SLA miss rate below 30% via real-time tracking and partner training. - Customer Re-engagement:
Win back high-value customers with targeted loyalty campaigns. - Restaurant Stability:
Retain top partners with guaranteed minimum order volumes. - Marketing Strategy:
Shift budget toward brand trust and service reliability campaigns.
🧩 Tech Stack
| Tool | Purpose |
|---|
| MySQL | Data staging, cleaning, transformation |
| Power BI | Data modeling, DAX, and interactive visualization |
| PowerPoint | presentation & storytelling |
| GitHub | Project version control and documentation |
🌟 Learnings
- Designed a complete BI workflow from raw data to insights.
- Understood importance of data validation and integrity before modeling.
- Strengthened DAX and storytelling skills for business decision-making.
- Learned how to design professional Power BI themes and backgrounds for consistency.
🏁 Conclusion
This project demonstrates how a data analyst can blend technical skills (SQL, DAX, Power BI) with business understanding to create impactful insights.
The QuickBite Express Dashboard serves as a recovery blueprint for any business looking to rebuild customer trust through data.
🤝 Connect With Me
👤 Akash Gupta
🌐 LinkedIn
#PowerBI #SQL #DataAnalytics #Codebasics #DashboardDesign #BusinessIntelligence #DataStorytelling #PortfolioProject