Ankita-Store-Date-Analysis (Interactive Dashboard creation using MS Excel)
- Developed an interactive sales performance dashboard in Excel, incorporating pivot
tables, slicers, and dynamic charts.
- Visualized key performance indicators (KPIs), including total sales and regional
performance metrics, enabling quick executive reporting and informed decision support.
Project Objective
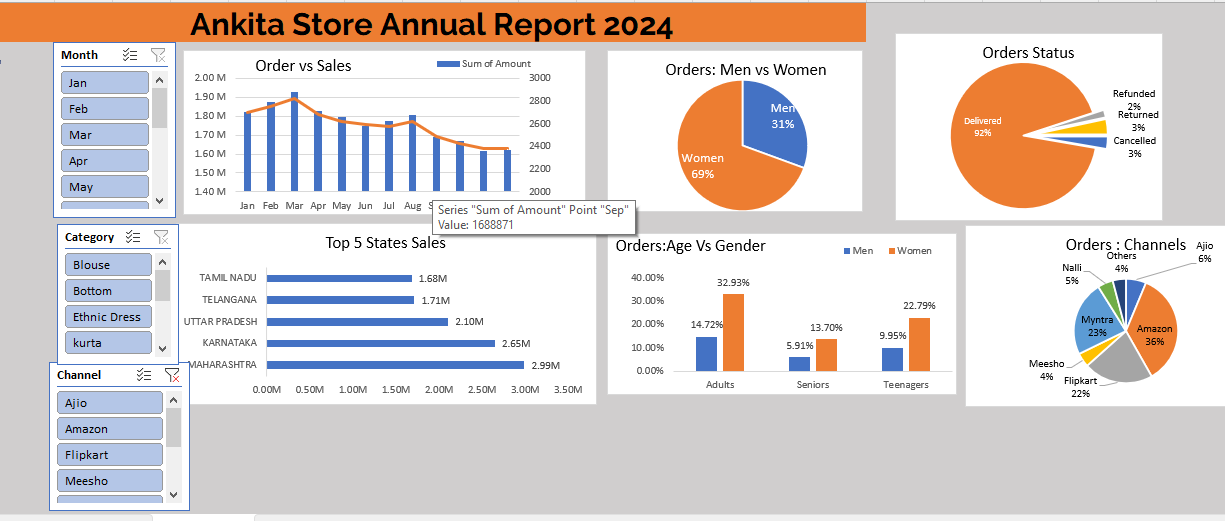
The Ankita store want to create an annual store report for 2024. So that, The owner of Ankita store can understand their customer purchase behaviour and buying habit and can grow their sales in 2025.
Download Worked File - Click Here
If the preview does not load, open the workbook directly: store_analysis.xlsx.
Process
- Verify data for any missing values and anomalies, and sort out the same
- Made sure data is consistent and clean with respect to data type, data format and values used.
- Created pivot tables according to the question asked
- Merge all pivot tables to a single dashboard to make it dynalmic and also apply the slicer
Actionable insights
- Investigate the declining sales trend, considering factors like seasonality, competition, marketing effectiveness, and customer experience.
- Focus marketing efforts on the dominant female customer base.
- Optimize performance on key sales channels (Myntra, Amazon, Flipkart) and investigate the “Others” category.
- Analyze product category performance to inform inventory and marketing decisions.
- Investigate reasons for returns, refunds, and cancellations to improve processes and customer satisfaction.
- Leverage insights from top-performing states to enhance sales in other regions.