🐾 Animal Shelter Operations Analytics
Power BI Dashboard | ZoomCharts Challenge
An end-to-end analytics project built using Power BI and ZoomCharts, focused on understanding animal shelter operations and generating data-driven insights to improve save rates, reduce length of stay (LOS), and support operational decision-making.
📌 Project Overview
Animal shelters operate under capacity, staffing, and time constraints.
This project analyzes animal intake and outcome data to identify operational patterns, performance gaps, and improvement opportunities related to:
- Intake volume & seasonality
- Adoption and live-release performance
- Length of stay (LOS)
- Repeat intakes
- Resource and prevention strategies
The goal is to move beyond reporting and deliver actionable insights that support animal welfare and shelter efficiency.
📂 Dataset Description
Source:
City of Long Beach Animal Care Services (via DataDNA / ZoomCharts Challenge)
What the dataset represents
Each record corresponds to an animal intake event, capturing the full lifecycle of an animal’s shelter stay—from intake to outcome.
Key attributes include:
- Animal Details: Species, breed, age, sex, color
- Intake Information: Intake date, intake type, intake condition, intake source
- Outcome Information: Outcome type, outcome date, live-release indicators
- Operational Fields: Length of stay, current resident status
This structure enables longitudinal analysis, including repeat intakes.
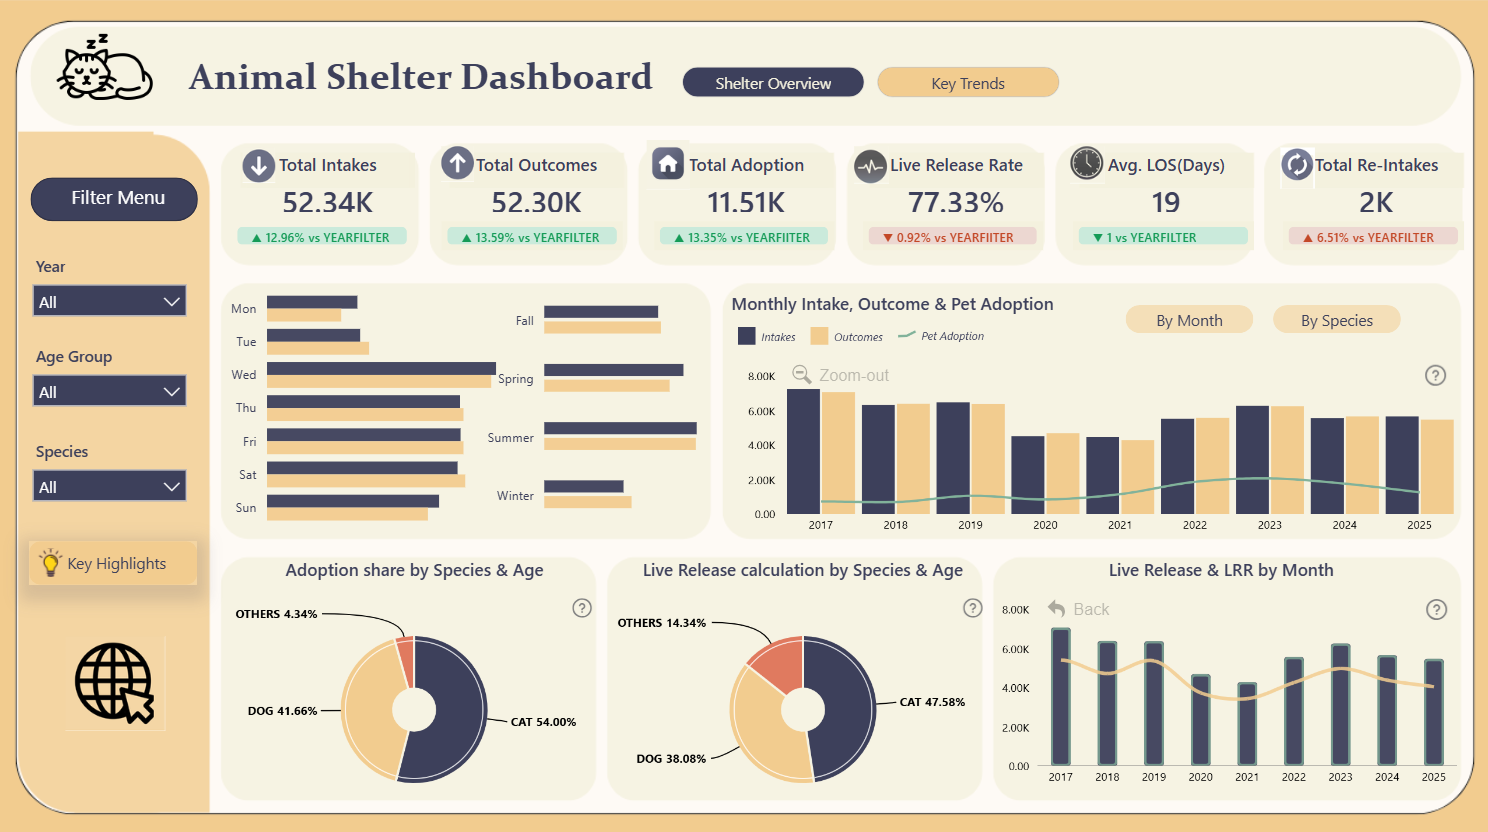 Homepage
🧹 Data Preparation & Cleaning
Significant preparation was required to ensure analytical accuracy.
- Parsed and standardized date fields (DOB, intake date, outcome date)
- Corrected negative or invalid age values
- Handled missing DOB values safely
- Cleaned and standardized text fields
- Replaced missing categorical values (e.g., secondary color)
- Created a standardized outcome classification to simplify analysis
These steps ensured the data was consistent, reliable, and visualization-ready.
To support deeper analysis, several calculated fields and measures were created.
- Age at Intake (calculated with validation)
- Age Groups (Baby, Young, Adult, Senior)
- Length of Stay (LOS)
- Includes animals still in shelter
- Live Release Rate (LRR)
- Excludes current residents from denominator
- Repeat Intake Flag
- Identifies animals with multiple intake records
- Calendar Table
- Enables YoY, monthly, and weekday analysis
These transformations enabled accurate KPIs and operational insights.
📊 Dashboard & Analysis Highlights
The Power BI report answers key operational questions such as:
- How do intakes and outcomes vary over time?
- Are there seasonal or weekday intake patterns?
- Which species, age groups, or conditions drive long LOS?
- Which intake sources contribute most to volume?
- Which animals are at risk of repeat intake?
- What actions could improve save rates and reduce LOS?
Interactive visuals were built using ZoomCharts to support:
- Drill-down exploration
- Cross-filtering
- Intuitive navigation for business users
🔍 Key Insights
- Intakes peak during summer months and mid-week, enabling proactive staffing plans
- Cat intakes surge in summer, driving longer LOS compared to dogs
- Adoption rates have improved significantly over time, but live-release rates fluctuate
- Age, species, intake condition, and outcome type strongly influence LOS
- Repeat intakes are concentrated in specific outcome pathways, indicating prevention gaps
🎯 Data-Driven Recommendations
Based on the analysis, high-impact actions include:
- Seasonal foster and staffing expansion
- Targeted adoption campaigns for seniors and long-stay animals
- Medical fast-tracking for mild-condition cases
- Post-adoption and post–return-to-owner follow-up programs
- Community prevention initiatives focused on high-volume intake sources
🌱 Personal Learning & Growth
This project strengthened my skills in:
- Power BI data modeling and DAX
- KPI design grounded in business logic
- Analytical storytelling for decision-makers
- Using ZoomCharts for interactive insights
- Translating analysis into operational recommendations
Most importantly, it reinforced that effective analytics is about driving decisions—not just building dashboards.
🧾 Conclusion
This project demonstrates how operational data can be transformed into actionable insights that improve animal welfare outcomes and optimize shelter operations.
It reflects a complete analytics workflow:
data preparation → analysis → insight → recommendation.
🔗 Project Links
👤 Author
Built by Akash Gupta
⭐ If you find this project interesting, feel free to connect or share feedback!